Quick Start Guide
This guide walks you through the minimal, end-to-end workflow to set up your first schema, populate data, track metrics, and build a visual dashboard in Omnismith.
⏱️ Step-by-Step Workflow (10–15 Minutes)
Section titled “⏱️ Step-by-Step Workflow (10–15 Minutes)”Step 1: Create or Select a Project
Section titled “Step 1: Create or Select a Project”- Log into your Omnismith workspace.
- From the top left header menu, click the Project Switcher to select an existing project or click + Create Project to set up a new workspace.
Step 2: Choose Your Setup Method
Section titled “Step 2: Choose Your Setup Method”When starting in a fresh project, you can choose:
- Option A (Instant Blueprint): Click Install on a featured blueprint (e.g. Crisis Management or IT Asset Tracker) from the welcome dialog to deploy ready-made templates and sample data in seconds.
- Option B (Custom Schema): Click Start Empty to define your data model step-by-step from scratch (detailed below).
Step 3: Define Attributes (Data Building Blocks)
Section titled “Step 3: Define Attributes (Data Building Blocks)”If building custom data models, define your attributes first:
- Navigate to Blueprints → Attribute Library in the sidebar navigation launcher.
- Click + Create Attribute.
- Create your key fields. For example, for an IT Server & Service SLA Tracker:
- Hostname: Type = Dimension, Data Type = String (Standard text field)
- Environment: Type = List, Options =
[Production, Staging, Development] - Status: Type = List, Options =
[Online, Degraded, Offline] - CPU Usage (%): Type = Metric, Data Type = Number (Numeric field tracked over time)
- Latency (ms): Type = Metric, Data Type = Number (Numeric field tracked over time)
Step 4: Create a Template (Schema Blueprint)
Section titled “Step 4: Create a Template (Schema Blueprint)”- Navigate to Blueprints → Template Library.
- Click + Create Template.
- Enter a title (e.g.
Server Node) and description. - On the Attributes tab, attach the attributes you defined in Step 3 (Hostname, Environment, Status, CPU Usage, Latency).
- Click Save Changes.
Step 5: Create and Update Entities (Data Records)
Section titled “Step 5: Create and Update Entities (Data Records)”- Navigate to Workspace (or select
Server Nodefrom the navigation sidebar). - Click + Create Entity.
- Fill in initial attribute values:
- Hostname:
prod-app-server-01 - Environment:
Production - Status:
Online - CPU Usage (%):
42 - Latency (ms):
15
- Hostname:
- Click Save.
- Update metric attributes periodically (e.g. update CPU Usage to
88and Latency to120). Omnismith automatically logs every metric update into the time-series database with exact timestamps.
Step 6: Explore Filtered Queries & Historical Analytics
Section titled “Step 6: Explore Filtered Queries & Historical Analytics”- Search & Filter: On the Entity list page, click Filter to query entities by specific conditions (e.g.,
Environment = ProductionANDStatus = Online). - Audit History: Open an entity and click the History tab to inspect the complete change audit log of every attribute update.
- Metric Chart: Click the Chart tab to visualize how metric values (like CPU Usage or Latency) have changed over time with configurable bucket widths (minute, hour, day).
Step 7: Build Your First Dashboard View
Section titled “Step 7: Build Your First Dashboard View”- Navigate to Dashboards → Search.
- Click + Create Dashboard and enter a name (e.g., Infrastructure Operations Portal).
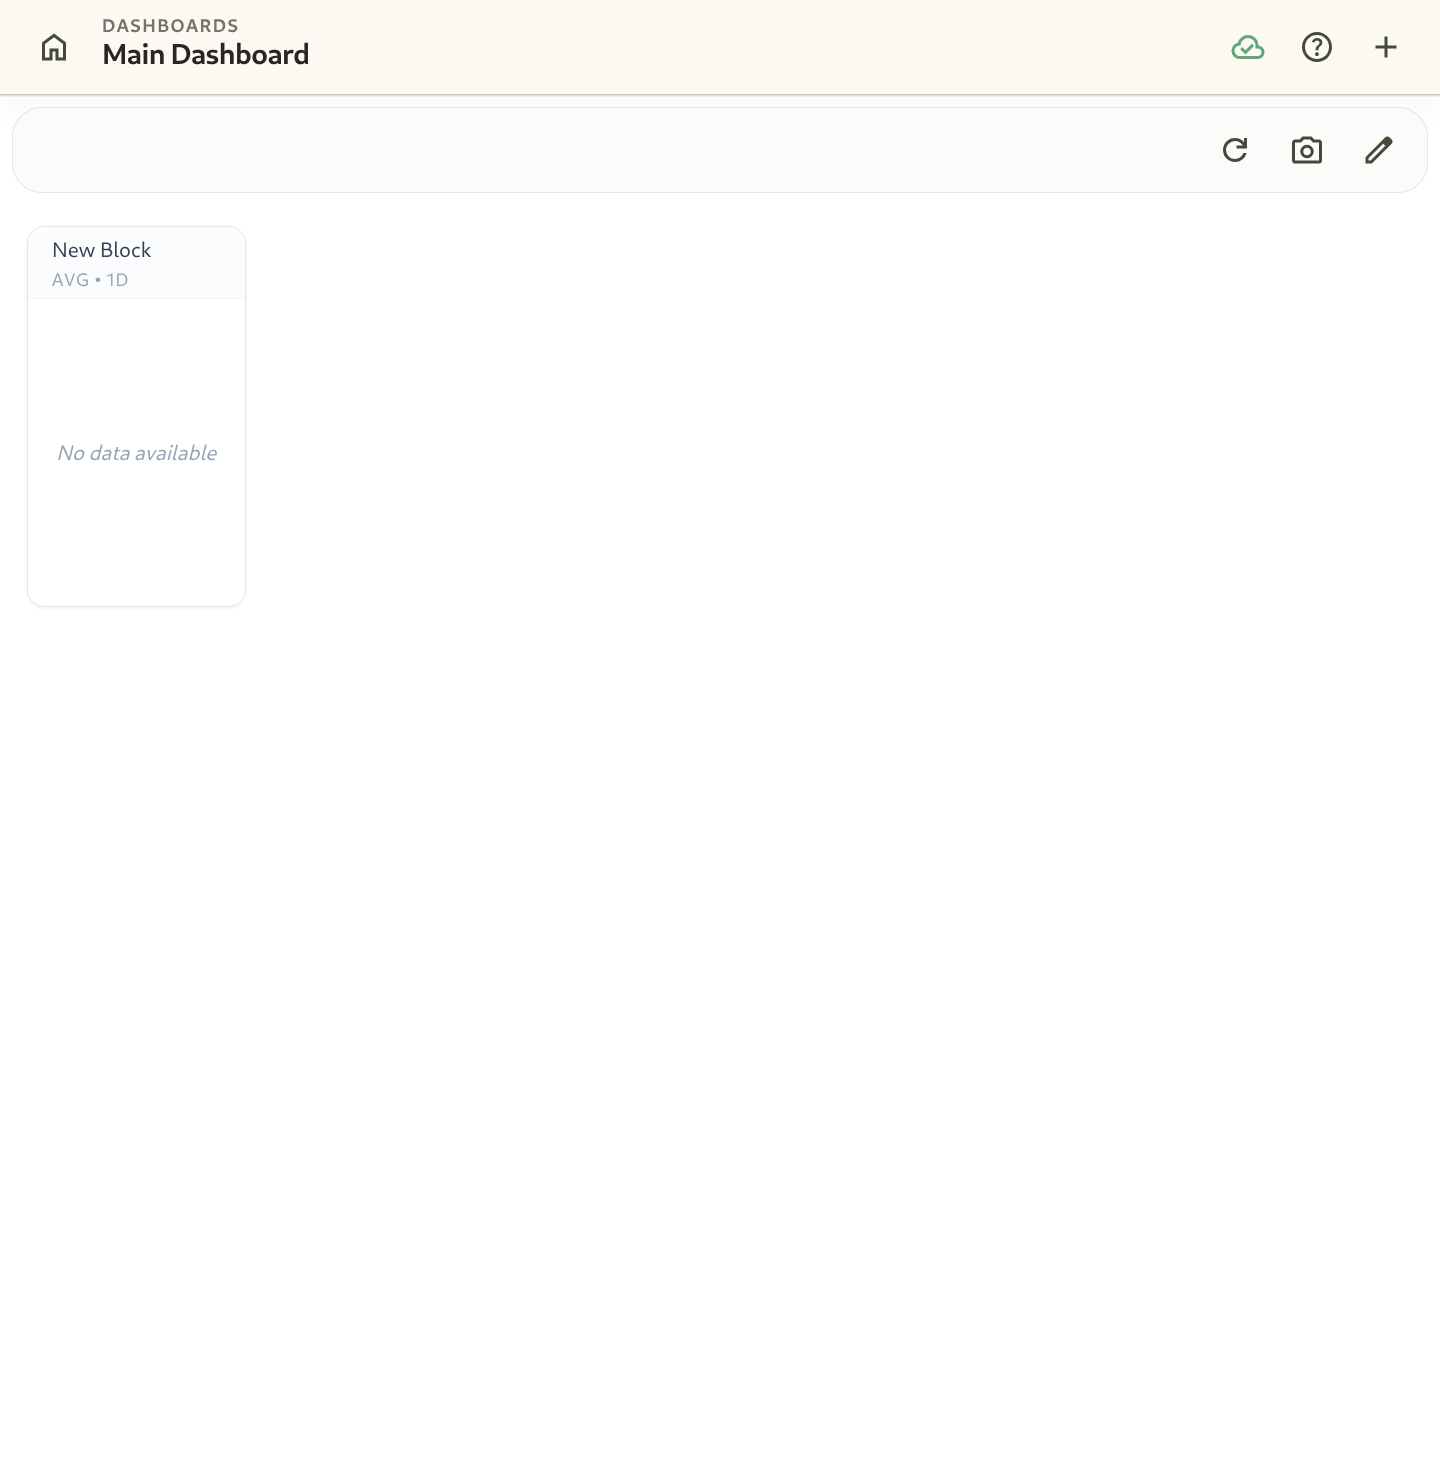
- Click + Add Block to place a chart or summary block onto your dashboard canvas.
- Select the target Template (
Server Node) and metric fields to aggregate. - Drag and resize blocks to customize your layout.