
History and Chart
Every entity in Omnismith includes dedicated History and Chart workspace tabs for detailed audit logging and real-time metric analytics. The Attributes tab also shows a short summary of both in its side rail, so you can check a record at a glance without switching tabs.
1. The History Tab (Immutable Audit Log)
Section titled “1. The History Tab (Immutable Audit Log)”The History tab tracks every modification made to an entity’s dimensions, list options, and references over time.
Features & Controls:
Section titled “Features & Controls:”- Before / After Comparison: Shows the exact previous value and new value for changed attributes.
- Timestamp & Attribution: Displays exact date, time, and user account (or API key) responsible for the update. Changes written by an Automation are attributed to Automation · {name}.
- Date Range Filters: Filter historical changes by custom time windows.
- Attribute Filtering: Isolate changes to specific fields (e.g. Show only changes to the Status field).
2. The Chart Tab (Time-Series Metric Analytics)
Section titled “2. The Chart Tab (Time-Series Metric Analytics)”The Chart tab plots numeric Metric attributes over time using high-performance time-series analytics. It offers two views, switchable at the top of the tab: Overview and Custom.
Overview
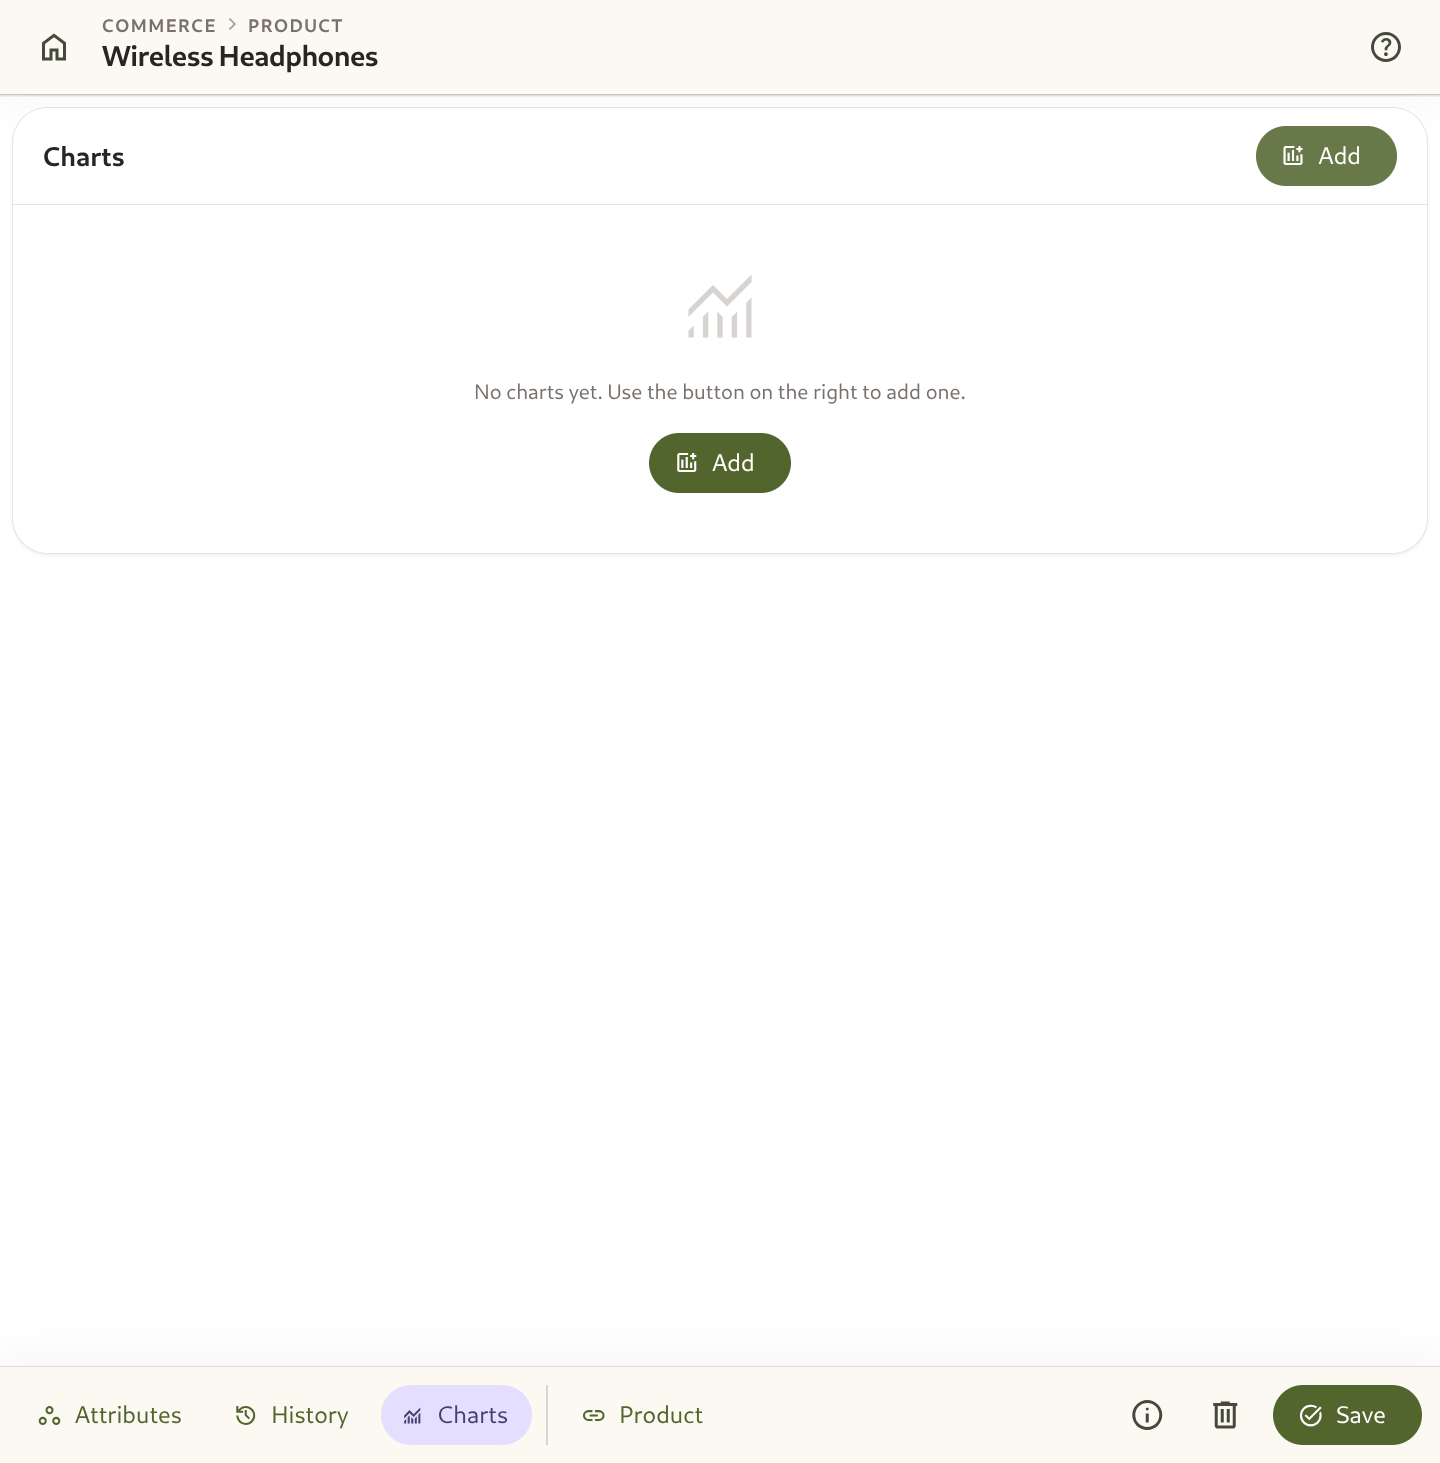
Section titled “Overview”The Overview shows one compact chart for every metric on the entity’s template, arranged in a responsive grid, with no setup required.
- Shared Time Range: Switch all charts at once between the last
1h,24h,7d, or30d. - Shared Aggregation: Apply one aggregation function (see below) to every chart.
- At-a-Glance Values: Each chart shows the latest value along with the minimum and maximum for the selected range.
- Open as Custom Chart: Expand any metric into a full-width custom chart that keeps the same range and aggregation, ready for deeper investigation.
- Pin to the Record Summary: If you can edit the template, each chart has a pin button. A filled pin means the metric appears in the metrics summary on the Attributes tab. Click it to add or remove the metric. A template can pin up to 8 metrics, and the button is disabled once that limit is reached.
Custom Charts
Section titled “Custom Charts”Custom charts are full-width charts you build yourself, combining one or more metrics.
Chart Controls:
Section titled “Chart Controls:”- Metric Selectors: Select one or multiple metric fields to plot simultaneously (e.g.
CPU UsageandMemory Usage). - Aggregation Functions:
AVG: Average value over each time bucket.SUM: Total cumulative sum.MIN/MAX: Minimum or maximum peak value recorded.FIRST/LAST: Beginning or ending reading in each bucket.
- Bucket Width: Aggregate readings into
1 minute,5 minutes,1 hour,6 hours,1 day, or1 monthtime buckets. - Interactive Tooltips: Hover over plot lines to inspect exact data readings and timestamps.
3. Metrics Summary on the Attributes Tab
Section titled “3. Metrics Summary on the Attributes Tab”The side rail of the Attributes tab opens with a compact Charts summary: one row per metric, with its current value, a sparkline for the selected range, and how much the value changed over that range.
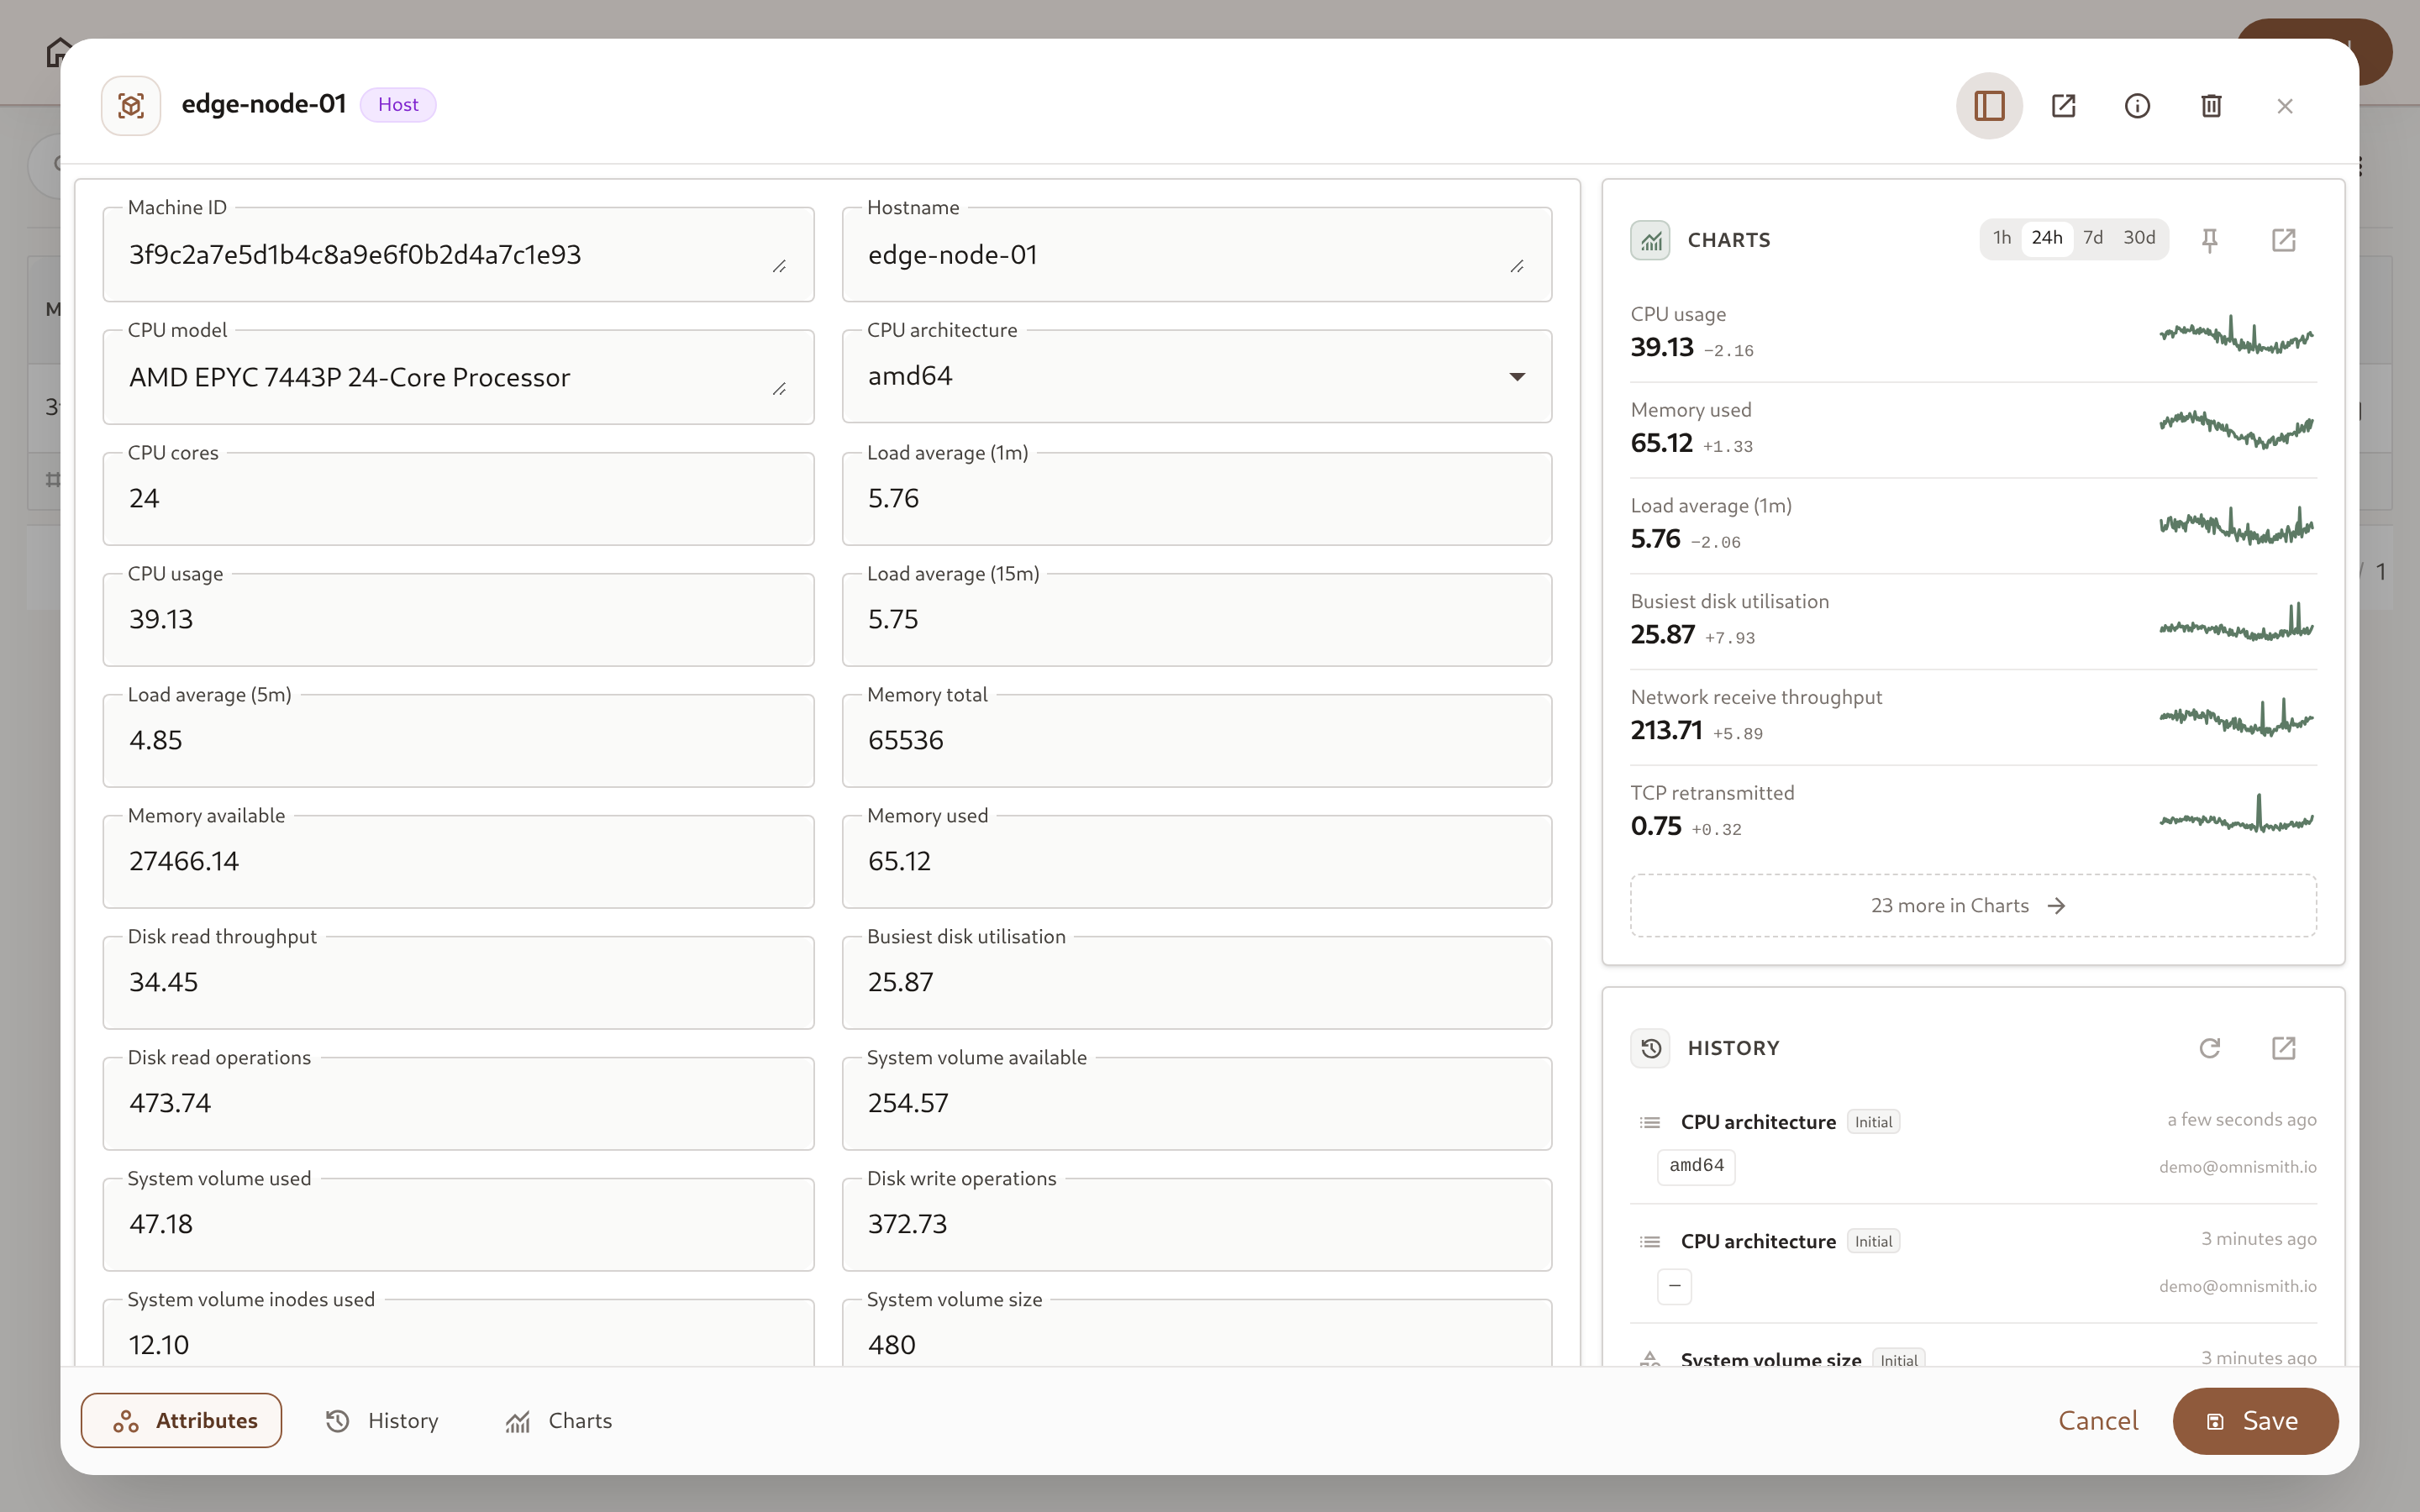
- Which metrics appear: The template’s pinned metrics, in their pinned order. If the template pins none, the summary shows its first six metrics.
- The rest are one click away: When the template has more metrics than the summary shows, a N more in Charts link opens the Chart tab, where the Overview shows them all.
- Shared Time Range: Pick
1h,24h,7d, or30d. The summary and the Chart tab’s Overview use the same range, so a choice made in one carries over to the other. - Change Over the Range: The small figure next to each value is the difference between the first and last reading in the range, in the metric’s own units (for example
+1.33on a percentage). It is hidden when nothing changed. - Choose the Pinned Metrics: If you can edit the template, the pin button in the summary header opens the Pinned metrics dialog. It starts from the metrics shown now. Add, remove, or drag them into a new order, then Save. Reset to default removes the pins and returns the summary to the template’s first six metrics. Changes apply to every record of the template.
You can hide or show the whole side rail with the rail button in the record header.
4. Backfilled & Out-of-Order Data Support
Section titled “4. Backfilled & Out-of-Order Data Support”If your metrics are logged from IoT devices, mobile apps, or background scripts with custom updated_at timestamps:
- Omnismith automatically inserts backfilled metric readings at their exact historical location in the timeline.
- Charts and audit logs correctly reflect past events without creating gaps or artificial spikes.
- The current value follows the newest timestamp. A late or backfilled reading is added to the chart history, but it never replaces a current value with a newer timestamp.
- One reading per metric per instant. A reading is identified by its record, metric, and timestamp. Sending the same reading again — a client retry, a resent batch — stores it once and counts it once toward your metric ingestion quota. If two different values arrive for the same record, metric, and timestamp, the first one received is kept.
- Give each reading its own
updated_atwhen one request carries several readings of the same metric. Readings without one are stamped with the time of the request, so they would share a timestamp and only the first would be kept.